Spring Boot file upload performance test at 7,500 RPM
This run measured FiloraFS-Lite under increasing target traffic from 500 to 7,500 requests per minute (RPM). It recorded latency, achieved throughput, CPU, memory, HTTP failures, and file-type behavior under the documented workload.
Observed summary
Observed: the run recorded zero HTTP failures at target rates up to 7,500 RPM. P95 latency rose above 1 second after roughly 6,300 RPM, and MP4 delivery had the highest recorded file-type latency.
Measurement context
Test environment
The original run did not record every environment value. Missing values are labeled explicitly rather than inferred.
| Area | Recorded value |
|---|---|
| Project | FiloraFS-Lite |
| Application version | Not recorded |
| Spring Boot | Not recorded |
| Java | Not recorded |
| CPU / RAM / disk | Not recorded |
| Operating system | Not recorded |
| JVM configuration | Not recorded |
| Database | Not recorded |
| Storage provider | Local filesystem |
| Load generator | TypeScript load runner |
| Network relationship | Not recorded |
| Warm-up / duration | Not recorded |
| Peak concurrency | 200 workers |
Workload
- Traffic ramped from 500 to 7,500 target requests per minute.
- The run covered mixed file workloads including PDF, PNG, and MP4 delivery.
- The recorded peak used 200 concurrent workers.
- Exact request ratios, file-size distribution, sample count, warm-up, and run duration were not recorded.
Reading the results
Latency, throughput, CPU, memory, and HTTP failure values are measurements from this run.
The file-type breakdown suggests large-media delivery was the main pressure point in the recorded workload.
Host specifications, JVM configuration, network relationship, exact request mix, warm-up, and duration were not recorded.
The results describe this local-storage test only. They are not a universal capacity claim for Spring Boot or other FiloraFS deployments.
Backend systems often look fast during development because they are tested with small payloads and low concurrency.
Real production traffic is different.
File uploads, video downloads, concurrent requests, and bandwidth pressure expose bottlenecks very quickly.
To understand the real limits of our system, we ran multiple load tests and a full ramp test against a Spring Boot file upload system using a TypeScript load runner.
The run recorded:
- Measure throughput under increasing load
- Track P95 latency degradation
- Monitor CPU and memory behavior
- Identify bottlenecks before production traffic does
Test setup
The backend under test was Spring Boot file upload boilerplate FiloraFS-Lite , our lightweight Spring Boot file-service boilerplate designed for rapid setup and local file storage experimentation.
FiloraFS-Lite includes ready-to-use APIs for:
- File upload
- File download
- Metadata lookup
- File listing
- Delete operations
The goal was to benchmark how this boilerplate behaves under sustained and increasing traffic before introducing production-grade optimizations like object storage, CDN delivery, and distributed file serving.
The ramp test gradually increased traffic from 500 RPM to 7,500 RPM while collecting:
- P95 latency
- Actual throughput
- CPU usage
- Memory usage
- Endpoint behavior
- File-type latency
Recorded results
| Metric | Result |
|---|---|
| Total requests | 134,517 |
| Peak RPM tested | 7,500 RPM |
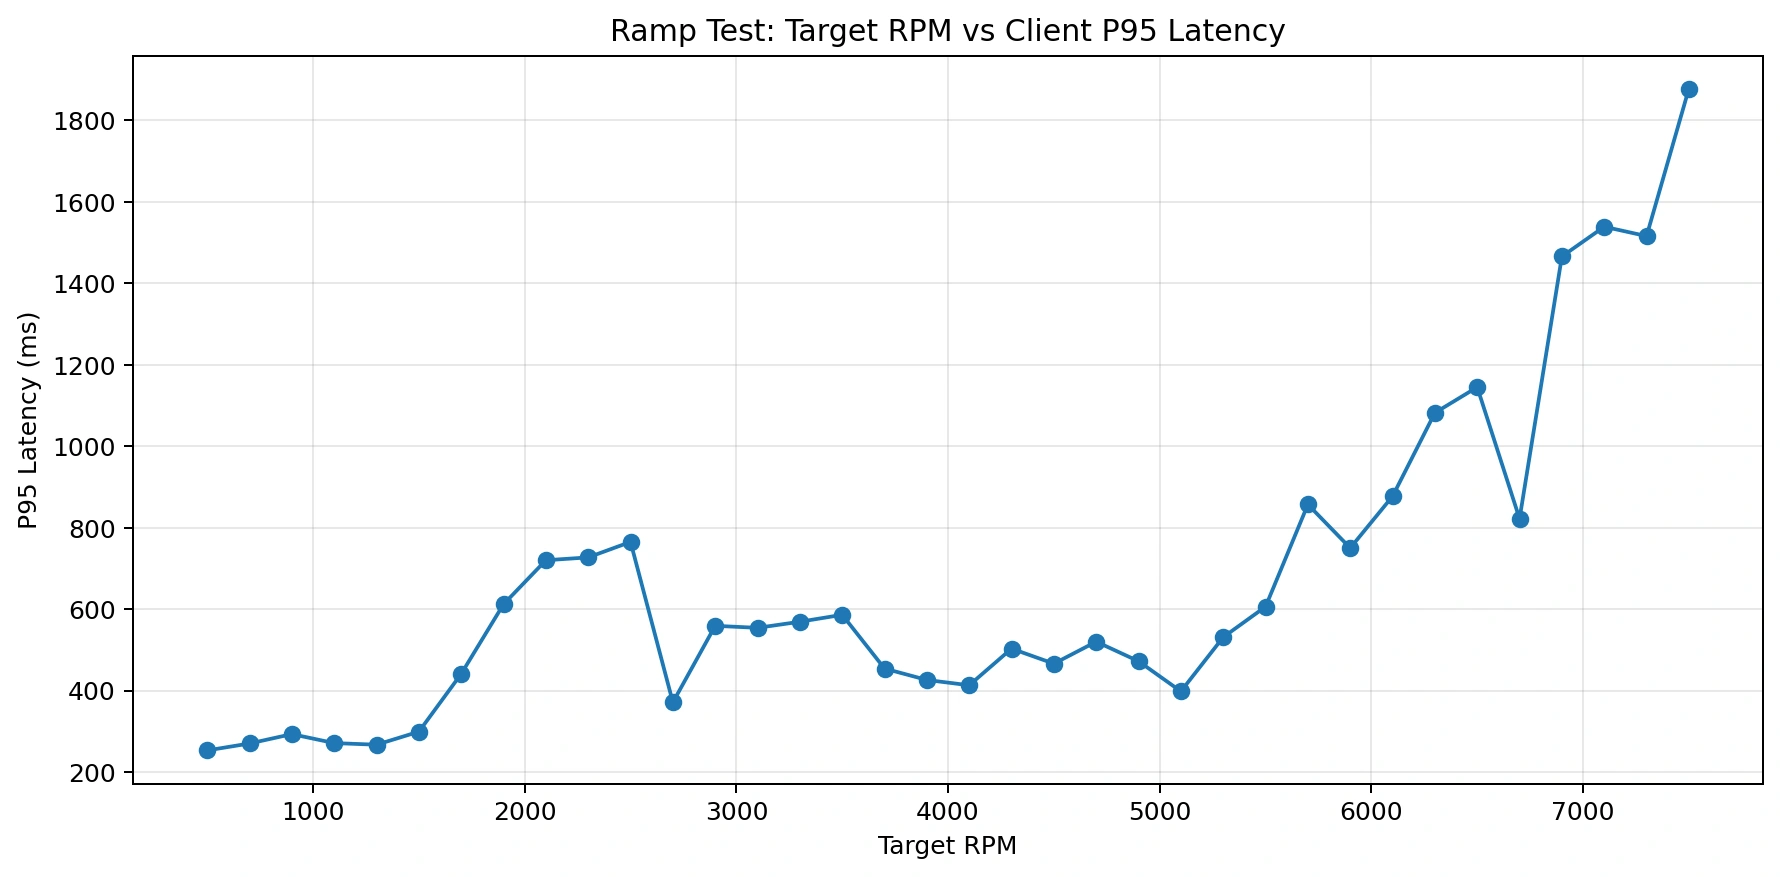
| Peak P95 latency | 1,878 ms |
| HTTP failures | 0 |
| Average CPU | 35.4% |
| Main bottleneck | MP4/video downloads |
Latency under increasing load
The system stayed comfortable during lower traffic levels.
From 500 RPM to around 5,100 RPM, the service mostly maintained P95 latency below 500 ms.
After roughly 5,700 RPM, latency began rising aggressively.
Once traffic crossed around 6,300 RPM, P95 exceeded 1 second and the user experience became visibly slow.
Practical operating zone
Observed in this setup: target rates around 5,000 to 5,500 RPM kept P95 latency near 500 to 600 ms. This is a test-specific observation, not a production-capacity recommendation.
Throughput under increasing load
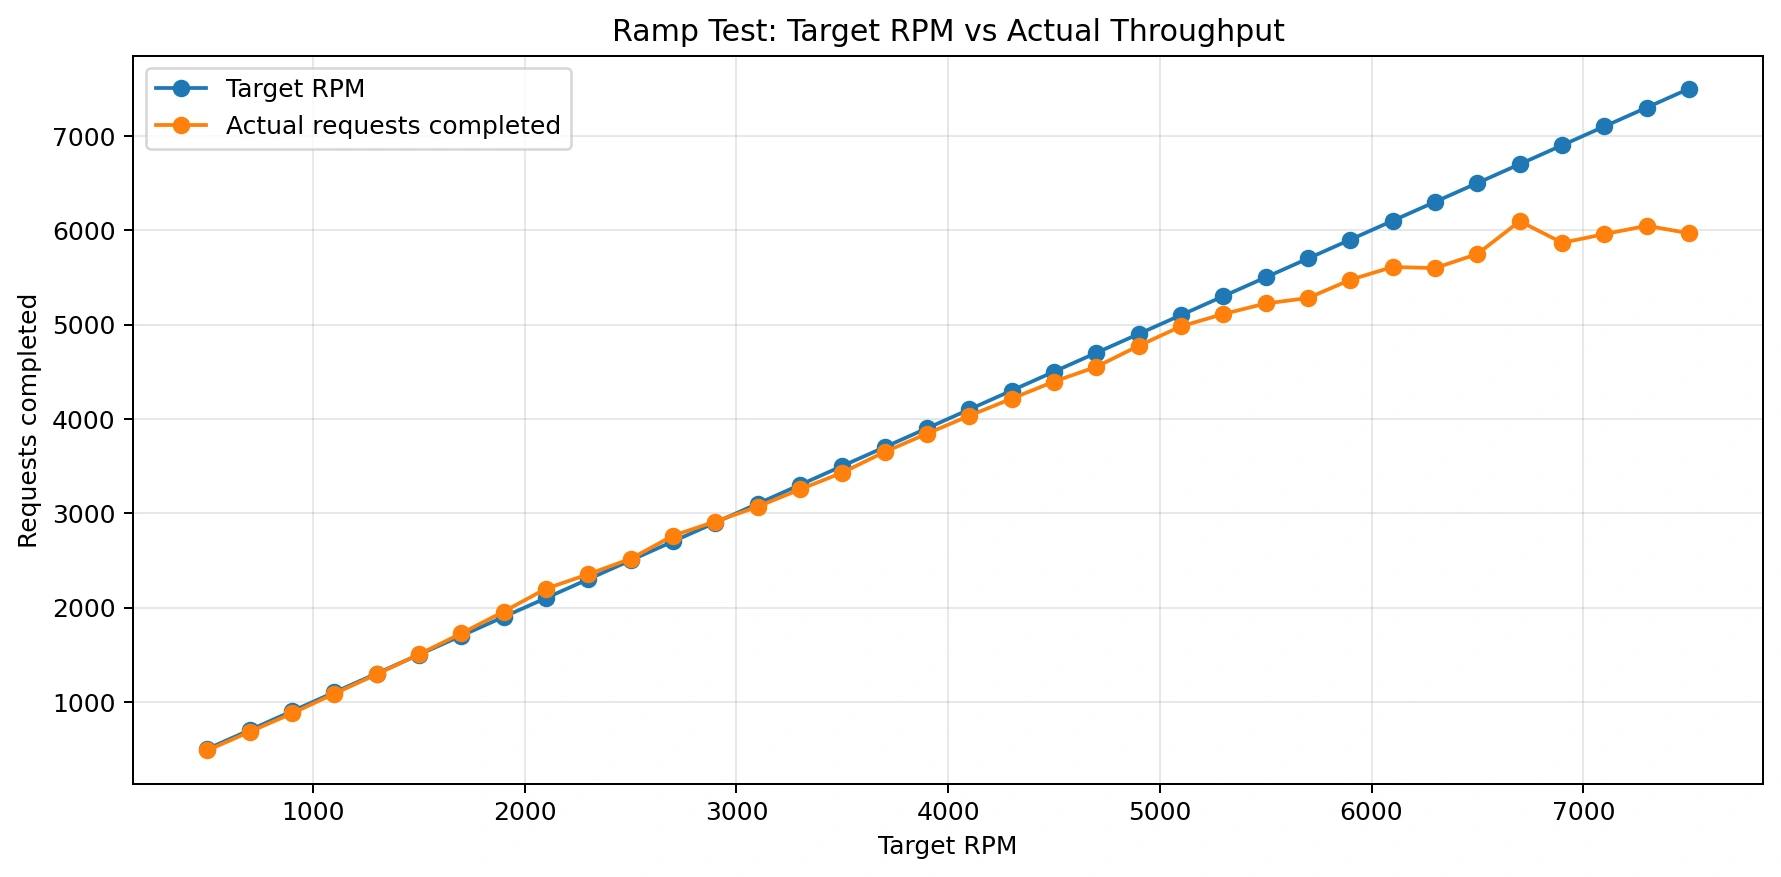
The run completed without a recorded HTTP failure at every tested target rate.
Even at high traffic levels, the backend continued responding successfully without HTTP failures.
The run recorded:
- 134,000+ requests
- 200 concurrent workers
- 7,500 RPM target traffic
- mixed file workloads
Failure count alone does not establish acceptable performance; latency had already degraded at the highest stages.
In this run, latency increased while requests continued to complete.
File-type latency
The endpoint and file-type breakdown did not identify these operations as the dominant latency source:
- Spring Boot controllers
- metadata APIs
- listing APIs
- delete operations
MP4 delivery had the highest recorded P95 latency and was the clearest pressure point in this workload.
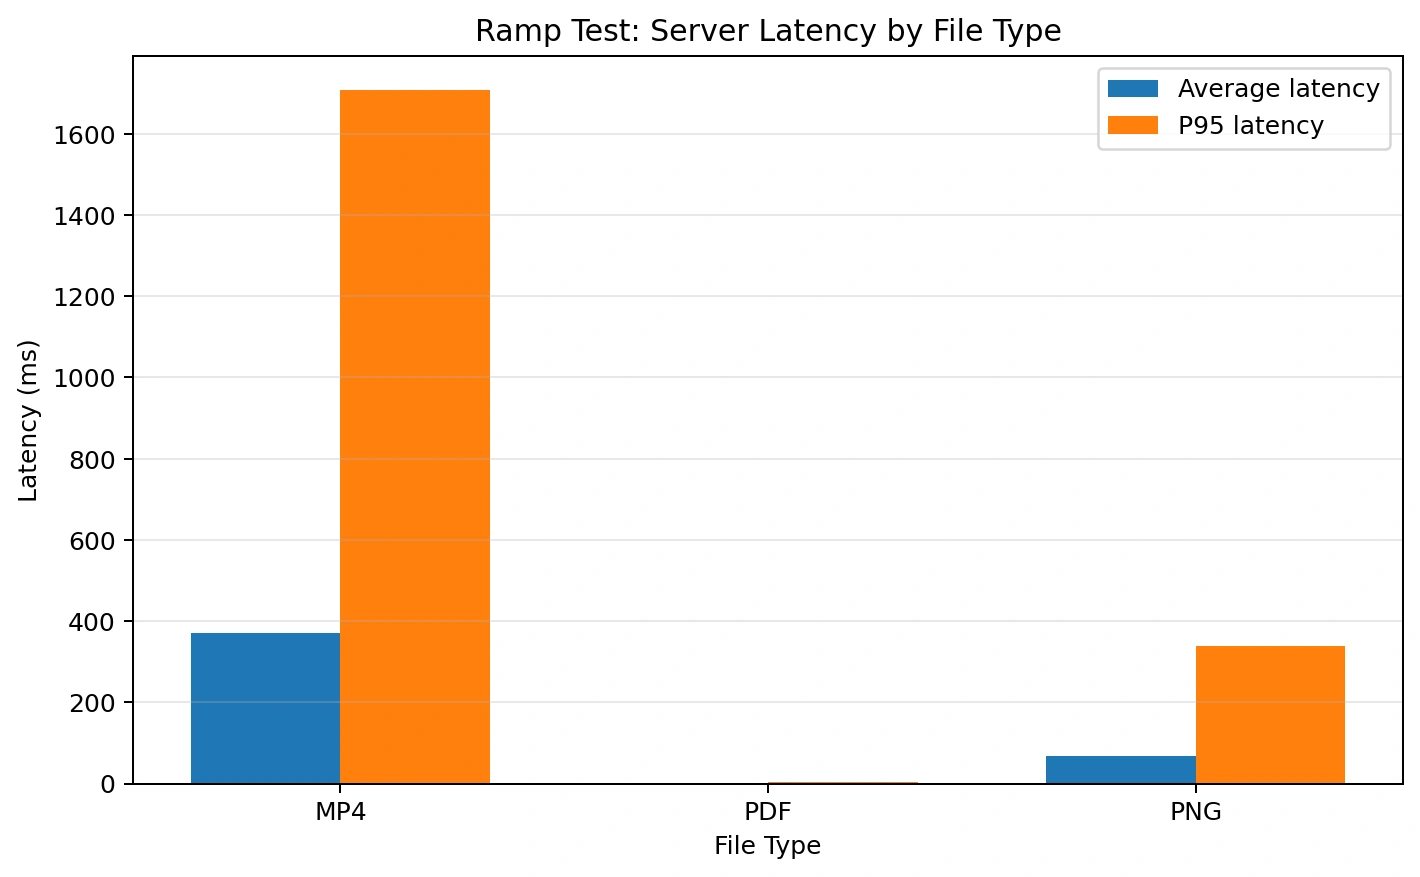
The file-type breakdown made the problem very clear:
| File type | P95 latency | Observation |
|---|---|---|
| 4 ms | Very fast | |
| PNG | 338 ms | Moderate |
| MP4 | 1707 ms | Main bottleneck |
The measurements are consistent with large-media delivery pressure, but disk, network, buffering, JVM, and thread contributions were not isolated separately.
Video files create pressure on:
- Disk IO
- Network throughput
- Buffering
- JVM memory
- Thread handling
CPU usage
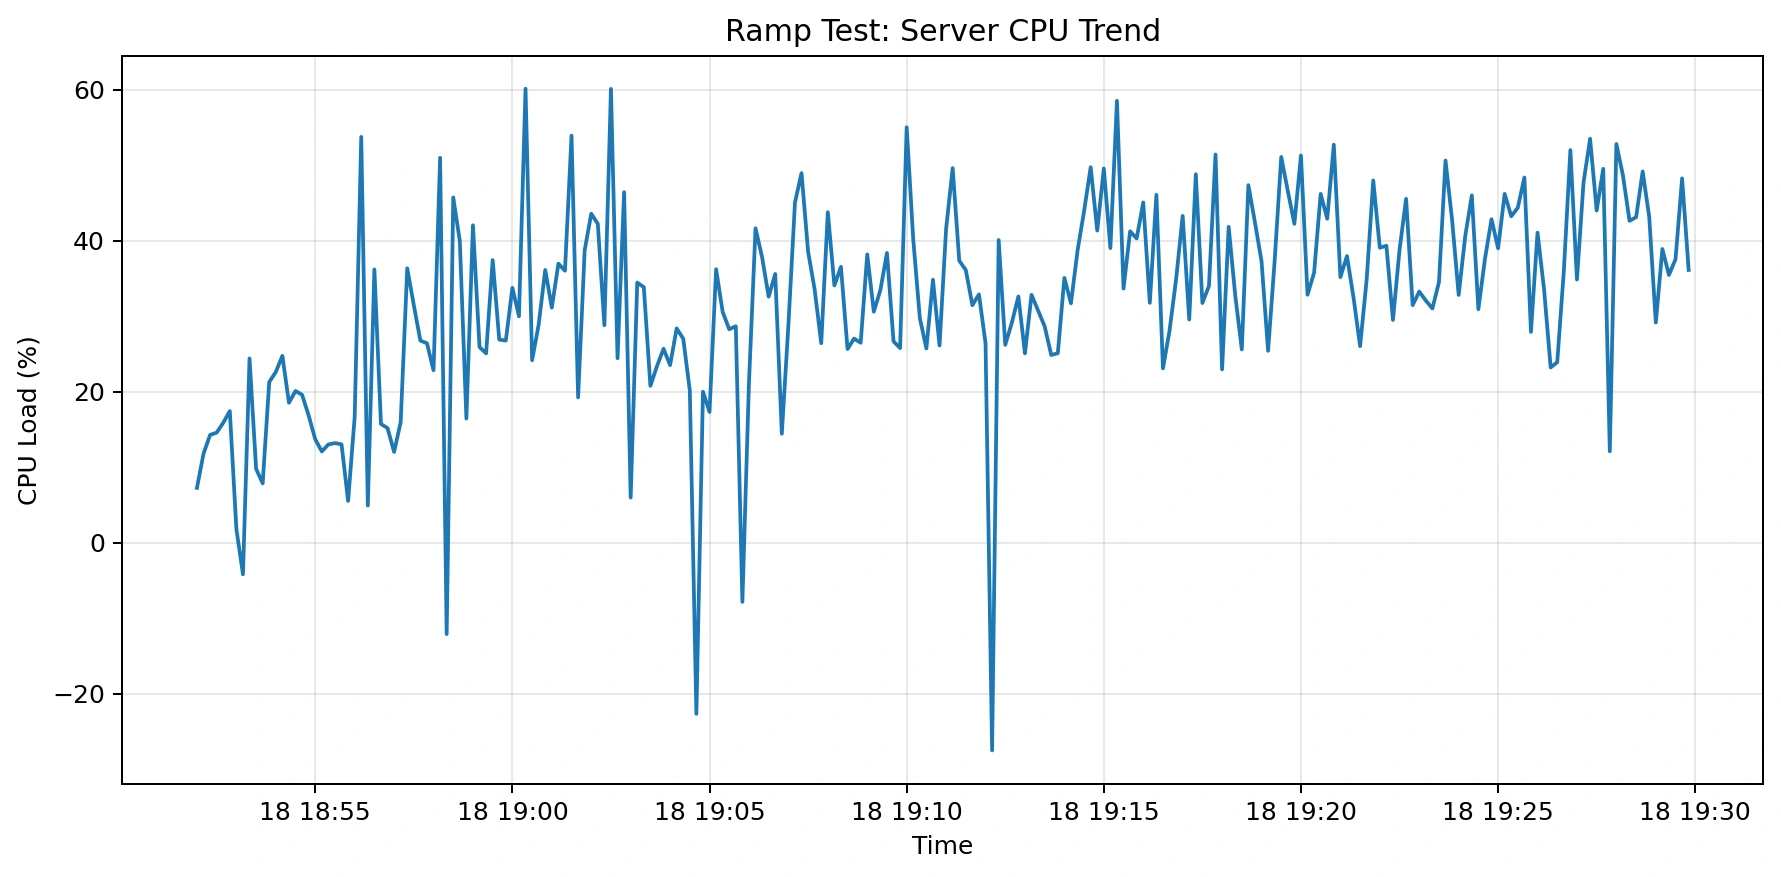
Recorded CPU increased with traffic, but the average value of 35.4% does not establish CPU as the limiting resource.
The file-type results suggest I/O and delivery behavior contributed more than application-level processing; the test did not isolate those components.
Average CPU was 35.4% during the recorded run. Host specifications and JVM configuration were not recorded, so the value should not be generalized to another environment.
Memory usage
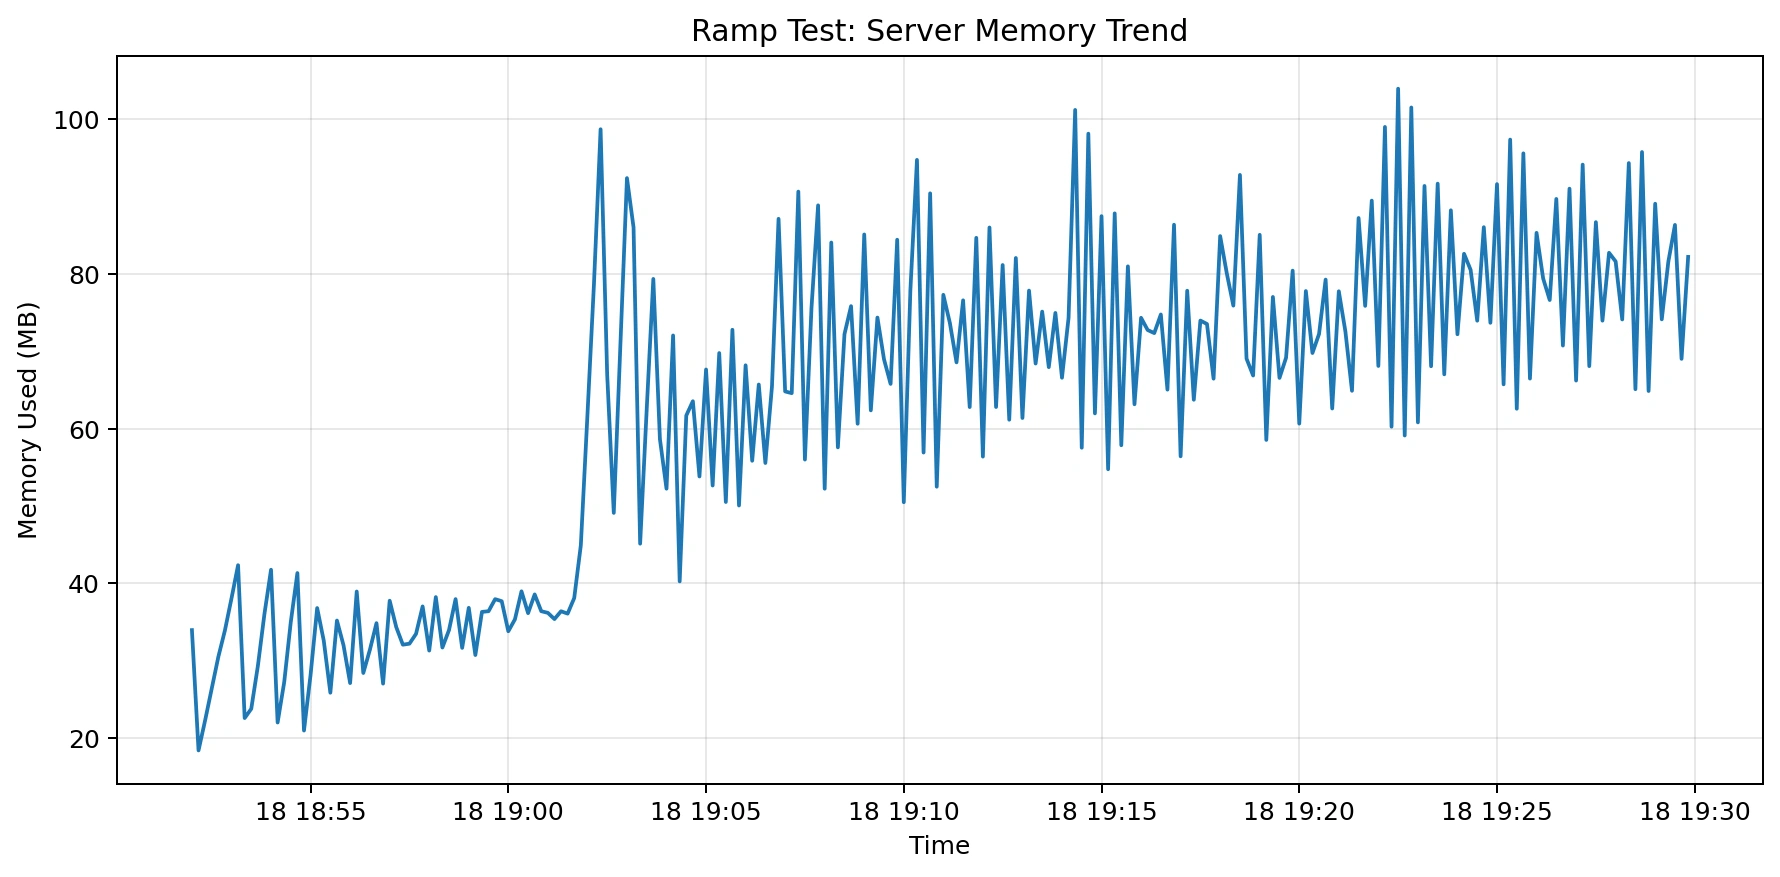
Memory usage increased gradually during heavier ramp stages and peaked around 126 MB.
The run recorded a peak near 126 MB. It did not establish a memory leak or isolate how much memory was attributable to buffering, file delivery, or other runtime behavior.
Bounded interpretation
The most important takeaway is this:
Within this workload, metadata-oriented operations remained faster than MP4 delivery. The test supports separating large-media delivery from application APIs as an architecture option, but it does not establish a universal Spring Boot limit.
A production review can evaluate separating:
- Business APIs
- Authentication
- Metadata handling
- Media delivery
Instead of streaming large MP4 files directly from Spring Boot, a production-ready Spring Boot file upload architecture should move file delivery to:
- S3-compatible object storage
- Cloudflare R2
- AWS S3
- CDN delivery
- Nginx static serving
- Signed URLs